17 Great Mobile App Analytics strategies to Grow Your App Today
By YML
Nowadays, every company has its own key performance indicators and target goals for their business.
Capturing data has never been easier, yet the more data we capture, the less we know about how to use it. This is especially true when it comes down to mobile app analytics.
The important questions, “ What should I track and what shouldn’t I?” and “ What is going to give me actionable data?” need answers, with ‘actionable data’ being the operative term.
Actionable.
What every business decision maker wants is not access to data per se, but the knowledge of what to do with the mobile app analytics collected.
In this article we will focus specifically on mobile app analytics best practices.
One last thing…
We make the assumption that you have launched or are about to launch a native application on either iOS, Android, or both.
We are providing a comprehensive list of all the different ways you can measure the success of your mobile application so that you could act fast to improve and maximize its value based on incoming data.
At the highest level, I believe that companies should come up with a strategy that allows them to track the following:
Let’s cover each section in more detail.
General “health status” mobile app analytics strategies
The general app “health status” is essentially the “state of the union” for your mobile app. Company executives will naturally gravitate towards revenue metrics, but many mobile products are not monetized right off the bat. There is a suite of data points that you must track which are not necessarily tied directly to revenue, but which still provide essential information.
1) App Downloads
Everyone looks at this, but the metric itself is not really actionable. Here’s why:


Source: Seven Strategies to Find and Encourage New Users to Download Your App.
The number of app downloads is the metric that’s most commonly-used to judge the performance of an app. Most companies are obsessed with their number of downloads, and consider it the most fundamental mobile app analytics metric. Substantial amounts of effort and money are spent on driving up these numbers. While it may be cool to gauge how many people download an app, I find this metric utterly useless. Here’s why:
Downloads don’t mean anything at the end of the day. It’s a badge of honor at best. More than 20% of apps that are downloaded are only used once.
When users uninstall an app after they’ve downloaded it, the download metric doesn’t change because in effect they did originally download the app.
You lose up to 95% of all your app users in the first 90 days of an app download anyway
Ultimately, the downloads metric is a function of marketing. If your marketing team does a good job then your downloads number goes up. We’ve all been there, telling everyone from the janitor to Jesus Christ how many thousands/hundreds of thousands / millions of downloads our app has scored. But those of us who have even the most basic understanding of true analytics know very well that this is not a useful thing to track.
Of course, the one caveat to this rule is paid apps, which are a dying breed. There was a time when pay-per-download was a very popular way for developers to make money. But a recent report shows that a staggering 94% of all apps across the two dominating App stores are free to download. Out of this remarkable shrinking number of paid apps, nine out of ten make less than $1,250 a day. Why? Because they can easily find another app to do the same thing for free.
If you are a developer who decides to swim against the current and force users to pay for your app before installing, then downloads would absolutely be a primary metric for you.
2) Retention Rates
Great mobile app analytics metric that helps with targeted user campaigns and engaging current customers
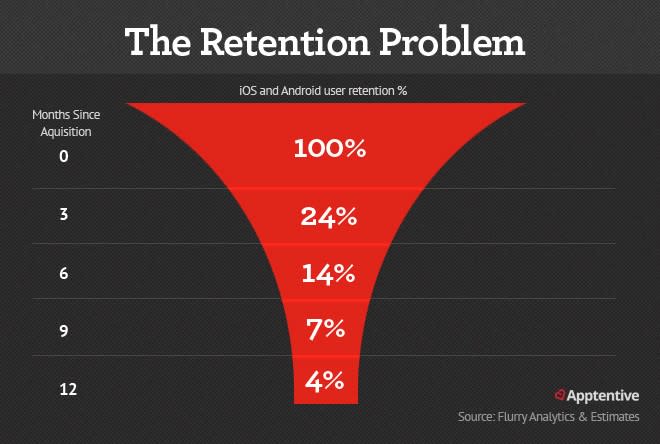

Source: The Five Mobile Marketing Metrics That Matter Most
Now here’s a data point that’s actually useful — your overall retention rate. This metric is both a function of your users’ in-app behavior (covered later in the article) as well as a metric tied to in-app monetization. Ultimately it is one of the most important mobile app analytics metrics, so you want to constantly track and report on it regularly. In its most basic definition, the retention rate is the percentage of users who return after their first visit.
Note that I say “visit” rather than “install”: users may install an app and never open it.
What you want to do is to specifically track the number of users who opened the app for the first time and constantly compare that to the number that return to the app. This is a key metric that allows you to implement strategies down the line that are specific to the percentage of users returning to your product. It also lets you create marketing campaigns aimed towards those who never installed the app or to those who abandoned the app after the first, second, third, etc., visit.
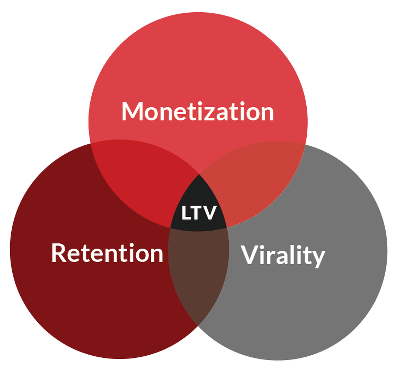
3) User Lifetime Value (LTV)
Track this and you’ll have the best predictor of future sales

Another key mobile app analytics metric is the lifetime value of a user.
Despite the fact that this is one of the most important things to track, companies are still struggling to implement this metric.
In typical revenue reporting, you measure how often people spent money in your app based on a certain interval (day/week/month/quarter/year). And that’s a totally legitimate way of tracking revenue for any product — period. But LTV is far more important. This is because it helps track not just revenue per user, but also the potential and future revenue that a user can bring. As such, it becomes a predictive metric for future app success. I’ve seen various companies deal with this metric in so many ways, but I personally side with the following simple definition, as explained by Apptamin here.
Let’s quickly explain each term:
Monetization: The amount of money your average user spends on your app until he/she no longer engages with it. That’s a combination of three metrics: average revenue per user; average revenue per paying user; and average revenue per daily user.
Retention: This is also called user engagement. As we saw above, you’ll measure how often people return to the app after the first session as well as how often they stay/ pay within the app until the point that they no longer use your product.
Virality: This is a strange word for a simple concept. It reflects how many new users a current user brings you by sharing your app through social media, word-of-mouth, or through any referral programs you’ve used to incentivize current users to convince their friends to engage with you. (An example of a referral program would be where you give 10 dollars and get 10 dollars when your friends do X in the app).
To quickly summarize, as Applift succinctly suggests, LTV is critical to understanding user engagement over the time between the first install and when a user no longer uses your app. It’s a great predictor of future retention rate and projected ROI.
4) In-app Referrals
Encouraging and tracking referral codes and success rates is of critical importance to your app’s success
Virality is a component of the Lifetime User Value metric, which is glancing at data points to see how often users organically share your application with their friends. However, in-app referrals are such an important factor in the overall success of your app that you should also track them separately.
We all know that acquiring new users is a fairly difficult and costly endeavor.
What better way to market your mobile solution than through the digital word of mouth of your users?
Tracking referral codes and success rates is of critical importance to your success. Not only should you be tracking it, but actively encouraging it and then tracking the success rate of that campaign. For example, does your app allow your customers to auto-generate a text message with a link to the download of the app? Text message referral campaigns represent one of the most successful ways to attract new customers.
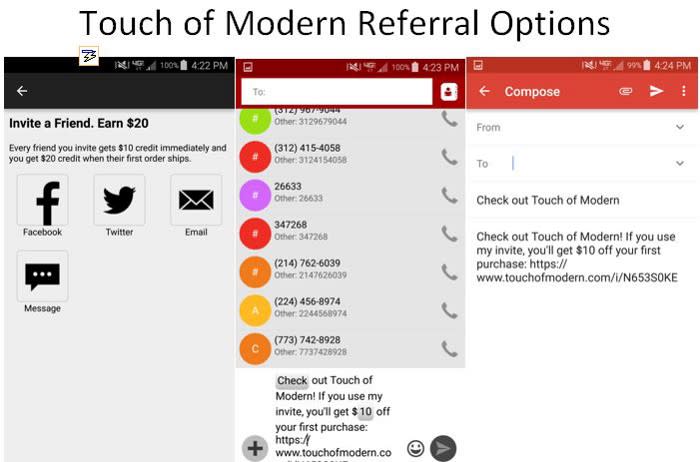

You should be separately tracking the various options that you make available for users to convince their friends to try out your new app.
As we see in the example above from the Touch of Modern application, there are certain industry-specific standards for the referral options available inside of an app: these include refer by email, refer by posting on social media accounts, and refer through the use of a personal unique code (which they don’t have at the moment).
Referral by text message is not standard practice, though given the efficiency of this funnel I suspect it will soon become one — as we see, Touch of Modern is ahead of the curve in that they offer it already.
It is also standard practice to offer a first-time discount (fixed or variable, e.g., 10% off or $20 off the first offer in the case of Touch of Modern) to the new user and some sort of kickback to the person making a referral. On average, this is between $5 and $15 per person referred who signed up on the new app — $10 in the example above.
App virality has become such a common practice that there are already a number of paid services that allow companies to maximize and track their app virality stats. Check this example for a more in-depth introduction to in-app referrals and marketing strategies.
5) App Performance Analytics
If your app performance isn’t good, a great design and user experience will not matter
I’m going to keep this simple: if you want your mobile strategy to be successful, you need to have an app performance monitoring tool. Every time, and I do mean EVERY time, an app performs poorly (crashes, lags, errors, slow load times), all your other metrics will be impacted.
This is such a critical thing that the analytics managers I work with have made a habit of coming to me and asking me whether I made a change on X date/ week that might explain a certain decrease in user engagement rates.
More often than not there’s a direct correlation between a sudden drop in user metrics and a performance event. If your app sucks at performance, your users will abandon you — it’s just that simple. So not only tracking, but also reporting on app performance analytics is a must have requirement for any legitimate business.
One in-depth report from App Dynamics goes so far as to consider the performance metrics on an application the most fundamental of all metrics, as you can see below:

Source: Appdynamics — 16 metrics to ensure mobile app success
In the same report, AppDynamics lists the following performance-specific metrics as the minimum viable metrics to track. I agree 100%:
App Crashes
App Latency
End-to-End Application Latency
App Load per Period
Network Errors
You can use this link above to read about each of these metrics in greater detail, as well as how to properly collect each of these data points.
6) App Ratings and Review Analytics
The overall success of your app will be significantly impacted by how people rate you and how you communicate with your customers when making improvements based on their feedback and ratings
We live in a world where ratings and reviews represent one of the most important factors in making a purchase decision. 88% of users look at reviews before engaging any business.
It goes without saying that your app reviews are critical in the overall success of your business. Not only can they help to deter people from downloading your app, but they also will impact your overall ranking in the app store.
In terms of app review engagement, the majority of users never leave a review. Of those who do, users are almost evenly split between people those who really like the app and those who really hate the app. This polarization means that people will most likely give you either a 1-star review or a 5-star review. Here’s some fun trivia: it is because most people rank either a 1 or 5 that Youtube entirely gave up their numeric rating system and replaced it with the “thumbs up” or “thumbs down” option.
This survey shows the breakdown of user engagement with app reviews on a global scale with more than 10,000 customers surveyed around the world.
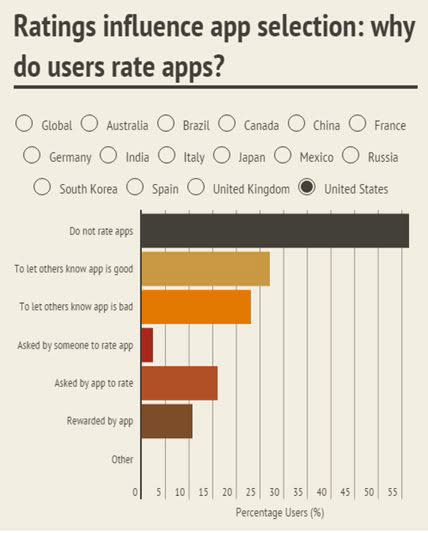

Source: Infogr.am — Worldwide survey of mobile app users
The point I am trying to make is that the overall success of your app can be impacted significantly by the ratings that you receive. As a general practice you should not only pay very close attention to your ratings, but also make sure you clearly communicate to users that their feedback is valuable and that you will take action on it.
We already showed that companies’ new release notes clearly call out what’s been improved based on customer feedback. As a company, you should always track this metric to ensure the overall satisfaction of your user base is high, and to track how reviews change as you respond to the constantly changing needs and expectations of your mobile users over time.
7) In-app feedback
Allowing users an easy way to report their pain points will lead to a better user experience and faster turnaround for fixing defects. Do it. Today.
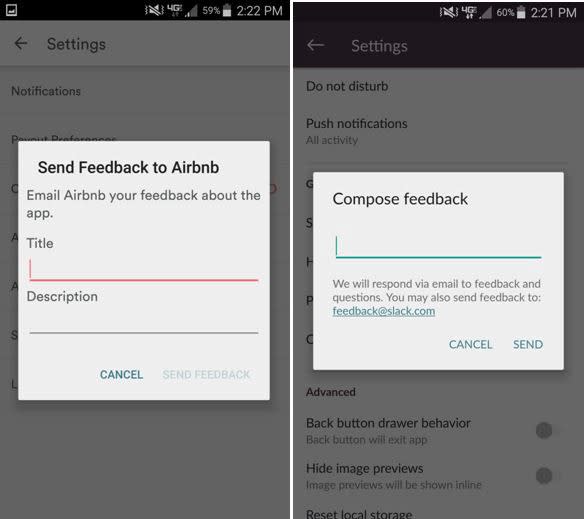

An in-app feedback option is becoming more and more popular among companies with a mobile app presence, and for good reason (see examples above from Airbnb and Slack apps).
Returning users — especially the loyal ones — will give you feedback. It takes just a minute for a user to give you in-app feedback, and if you implement it correctly, your logs will include the details of the app version, the device and the operating system.
Some companies go so far as to provide rewards to the users who engage with them through their mobile channel. I once received a free shirt from a company when I used their “Report a Problem feature”.
I tried to add a product to my shopping cart on their mobile app and the checkout button wasn’t working. Within 10 minutes of reporting the problem, I got a thank you email from the technical team and a code for a free shirt — I had obviously caught an issue that was impacting their revenue.
Even if you don’t want to incentivize users to find issues with your app (though I personally think you should), having a feedback option is something you should definitely consider. If just one issue is uncovered for every 100 reports, it is still one more than what your team discovered on their own, despite all the mobile app analytics tools and manpower you have at your disposal.
In-app Revenue Metrics
Whether you agree with this or not, most companies are interested in the bottom line. And with few exceptions — as in using the app to reduce the cost to serve for your company (read deterrents to calls) — revenue is what everyone obsesses about. There are various revenue metrics that are industry standards which you should also implement.
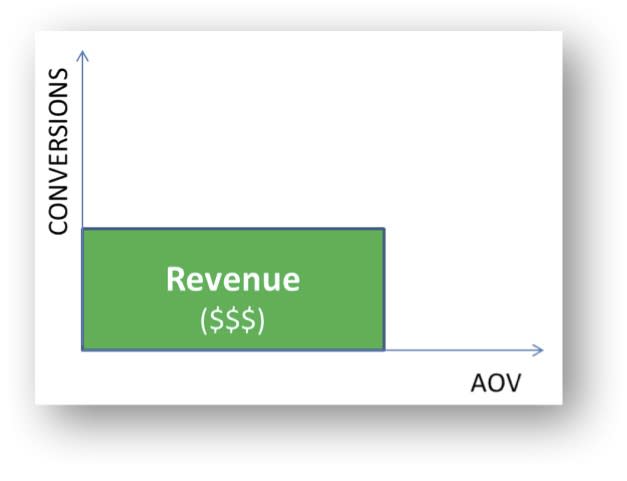
8) AOV Per User vs. AOV Per Paying User
Tracking AOV will help you determine the best strategy to maximize revenue per paying customers and to encourage non-paying users to transact on your application.

Source: HiConversion — Revenue Per Visit: The #1 metric to grow your e-Commerce revenue
If you’re in business, you’re trying to make money, and that’s where metrics like Average Order Value and Average Order Value per paying user become key metrics. The best example of the difference between the two is Candy Crush. I’m a Candy Crush sucker who has made in-app purchases. $1.99 here, $1.99 there.
What’s the harm, right?
By definition, I’m a paying customer with an AOV attached — last year I spent 15 bucks in total. Now according to King (the software company behind Candy Crush), 70% of users have never spent a dime on in-app purchases (source:). That means that King needs to differentiate between the two. They make close to a million dollars a day from paying customers. but that’s only 30% of their user base.
From a business point of view you want to track and report on the two AOV numbers so that you can set up two separate goals and act accordingly. First, to take the Candy Crush example, how do you tap into the 70% of active users who don’t make any purchase and decrease that percentage over time? Second, how do you increase Codrin’s AOV (and of course, the collective AOV for app paying customers) over the next year from, let’s say, 15 to 20 dollars? This is where AOV becomes a great data point that you should always report on in your business.
9) User Conversion Points
Conversion points represent the best metric to ensure that your app is meeting its financial goals through an exceptional user experience

Source: AnswerLab — Why User Experience Research
User conversion points refers to all the different funnels and events that can trigger a paid conversion. Each app is different because each company’s business model is different.
You may have only one conversion point or many.
You may also have conversion points that sit entirely outside of the app, such as an email marketing encouraging app adoption and engagement, like when Amazon offered in-app only deals for Black Friday last year.
User conversion points, as well as frictions to the user conversion flow, are critical for the use cases of the application. Ultimately, where and how a user converts is important because it tells you how quickly you can convince a user to buy something from you.
For example, in traditional mobile ecommerce, a user may add an item to their cart from a list of results based on a query performed (fancy word for typing a key word and tapping on search), from a listing of products in a sub-category (think “men’s shoes/ shoes under $100” page results), or from the product details page. The point is that you want to monitor the different conversion points and optimize them as much as you can for the desired result.
For example, if I go to the Amazon app and look up shoes but they show me pairs of jeans, then the search results are poorly implemented and I won’t convert.
Knowing what’s preventing users from converting at various key moments (when you could be convincing a customer to make a purchase) is of great importance to your app’s success.
10) Revenue to Target Reporting
Track this to ensure that your revenue goals are met and that your mobile strategy is working


This metric is primarily designed to keep the team honest during the year. Ideally, you want to set a realistic, yet ambitious, revenue goal for a set period of time. Then you want to measure your results against that goal and report on them.
More often than not, daily reporting is not the best goal due to the wide range of possible variables. But setting weekly revenue reporting, showing billed revenue versus target revenue, is a great and efficient reporting strategy. It keeps the team honest and informed with regards to the targets that need to be met.
A lot of companies don’t operate with this mindset, and that’s unfortunate. I am a product owner who manages the roadmap for a decent sized development team. I can tell you without a doubt that my roadmap prioritization changes dramatically if there’s a clear hard revenue goal (increase sales through online channels by 5% over the last year) versus a soft revenue goal (increase revenue for the company through the mobile channel).
Why would my behavior be different?
Personally, I am obsessed with user experience and with removing pain points. If there’s no hard KPI, I will optimize the sh!t out of an application until every comment in the app store is positive. Now, it’s true that my instinctive strategy could potentially lead to me hitting the revenue target, but that’s a correlation not a causation.
If I’m halfway through the year and I’m 30% under target, the type of features I’d prioritize to hit the target might be very different, and may even hurt the user experience I hold so dear. For example, in a previous role I was under target for a mobile app by 20% on both AOV and revenue with 4 months to go before the end of the fiscal year.
As much as I personally hate in-app overlays trying to upsell customers, I implemented one.
Though that led to a lot of frustration for many users — myself included — financially, it did the trick. We ended the year at 40% over target even though engagement went down and poor user feedback went through the roof. At the end of the day the point is simple: how / what features are built is always determined by what the target is for a certain period of time. Measuring and reporting current revenue towards target revenue is a great way to keep people focused and on track.
User In-app Behavior
This section covers what, how and for how long users are engaged with your app.
11) First-time User Drop-off Points
Tracking first-time user drop-off points, and then targeting campaigns to bring them back to the app and complete tasks, is a key mobile app analytics strategy for any mobile app.

This is a big one. Even when marketing does a good job and the user ends up downloading the app, it’s only half the battle. The “onboarding” of a customer is what takes time, finesse and constant deploy-measure-iterate sessions to get it right.
There are various reasons why a user may leave before converting during their first session:
App abandonment can happen because you tried to force the user to login/register too soon;
It could be that there were too many on-screen interruptions, or too many steps to complete a task;
Or the performance of the app may have been too bad.
The point is simple.
More so than with a website, you can easily track and retarget users who, for whatever reason, leave your app during the onboarding process. Tracking this and then having targeted campaigns to bring them back to the app and complete tasks is a lot easier with an app because you can retarget users through push notifications or emails. On a website you may never know who came and left, even if you know exactly what the cause was of their leaving (example: your website crashed at a given point and users left the website).
12) User-type Tracking
Know who your users are to ensure you’re successfully catering to different user types


Source: FIKSU — Audience Targeting
As we called out in our in-depth analysis of a mobile-app strategy, personas are critical to the overall success of an app. There are multiple user types that could be using your app at the same time, and it is very useful to start isolating the various segments you’re interested in and see how you can better engage them. In your user type analysis, you can be as broad or as specific as you wish.
You can look at age, income bracket, industry, men versus women — literally everything.
The point is not to simply divide users by type for the sake of division — it’s to analyze whether various user types are more or less likely to use your application in the current form. If need be, you can rearrange your roadmap to account for enhancements needed to further engage a certain user type.
For example, I once had to redesign the user controls for an app I managed due to “fat fingers”. When we did usability testing, everyone liked the app and was able to use it just fine.
But when we started tracking the app performance we saw an unusually high “back and forth” due to accidental tapping. When we looked at the app store we were amazed at the number of comments about how people with fat fingers accidentally tapped on targets which were simply too close to each other. This is just one example of a user type we didn’t think of and for which we had to make changes. I’ll always remember that fondly because it took me totally by surprise. As the boys on Comedy Central’s South Park would say, “I learned something today.” Read here for examples of more mainstream user types you should account for.
13) User Sessions
Track user sessions to understand user engagement on your app

Source: Similarweb — Find out How Engaged Users Really are with App Engagement
The number of user sessions is a basic metric that most mobile analytics groups in a mobile group report on. The formula is very basic: a single session is an uninterrupted period of time spent by a user from when they open the app until they close it. This metric is important primarily because it measures user engagement. Ideally you want as many user sessions as possible.
Another user session metric I value is this: how many sessions does it take, from the moment a user launches the app for the first time, until they convert? This metric can tell me if there are issues in the app flow, or if the content is not good enough on a mobile flow, for a user to quickly convert.
14) User time In App
Understanding how much time users spend inside your application will help you determine both their level of engagement with your mobile product and potential areas of improvement.


User time in app is a double-edged sword. On the one hand you want people to spend as much time in your app as possible — this is particularly true of gaming, news or social apps.
Many mobile app analytics gurus put a lot of emphasis on this.
For example, we know that — on average — users spend 18 times more time on native apps than on mobile websites. To some extent, that’s a good thing because more time in app equals more engagement.
However, as you’re looking at this metric you also need to look into exactly why and where people are spending their time. It can be because they’re really served by the content or functionality of the app, and if that’s the case, that’s awesome. It could also be because your app’s performance is very bad — not wo awesome.
A team I once worked with was boasting about the fact that users were spending 3 hours in app per day. Tt face value that’s a great engagement metric, but I later discovered that various pages took 5 to15 seconds to load, which obviously wasn’t at all a great thing or something to be proud of. Generally speaking, in-app engagement time is a good thing.
15) Session Interval
The frequency with which users return to your app is critical for predicting future engagements and potential revenue.

This is another very critical metric. What is the frequency with which users return to your app? Do people interact with your app every day/week/month, or less frequently? This is critical for two main reasons.
First, frequency of engagement and conversion is an indicator of future expectations. If I use Candy Crush every day but spend $1.99 on additional perks (lives, going to another level, lollipops, etc.) once every two months, then Candy Crush can expect a yearly revenue from me of $11.94. Multiply that by all active paying users’ averages and you get your annual projection.
The second reason why session interval is key is because you can then use it as a retargeting technique. I use SpotHero for my parking needs every two weeks and I never really got a true promotion. However, over the last 1.5 months I haven’t used it at all. Guess what? I received an email saying I have $5 off my next purchase. The point is that the company realized my engagement pattern and retargeted me because I’d moved from my habits. That’s a powerful thing.
As we all know, promotions are bad for business because they erode margins (duh!). But there comes a time when they are truly necessary, and probably the most important time is when a user loses interest in the app. As this infographic from SignalMind shows, the value of an existing, loyal customer is ten times higher than the value of a newly acquired customer. Session interval metrics allow you to engage users even after they lost interest in your app.
16) Event Tracking
Event tracking is the best way to ensure a very specific task within your mobile app works as expected.

Source: The Content Authority — How Do I Use Google Analytics for Event Tracking?
Here’s the most basic definition of an event: an interaction that a user has with content / functionality on a page. Think of the annoying pop-up asking, “Do you like my app? Give me 5 stars on the marketplace,” that every app has. That’s an event. So is my exasperated tapping on the button that allows me to dismiss the pop-up while thinking, “God I hate this so much, go away.”
As we saw in the app rating graph above, 15% of app ratings come through this funnel. This is huge, and yes — from a business case — a valid thing to pursue, as annoying as it may be to the 85% who dismiss it.
Event tracking is the best way to ensure a very specific task within your mobile app works as expected. For example, I launched a new feature 9 months ago. The analytics team set up event tracking for 7 different tasks within that feature. Three of them were almost never used. As a result, I’ll remove them from the feature during the next release. That’s why event tracking is so critical. It allows you to streamline your app, remove what’s not necessary, or improve what’s there for optimal usage (like the fat finger issue I talked about above).
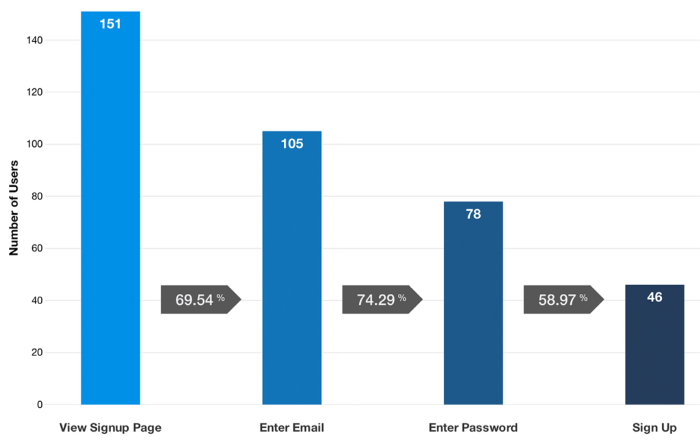
17) Funnel Tracking
You need to look at how people react with a funnel and their exit rates to find ways to improve it.


An event refers to a specific interaction with a piece of functionality on the app. A funnel refers to a set of interactions the user engages in, in sequential order, until a task is completed.
The checkout for any eCommerce websites is a funnel. The user goes from cart, to shipping/billing, to placing an order. Whether you have 1, 2, 3, 4 or 5 steps in checkout, measuring this effectively is key. The real goal of funnel metrics is to measure the delta between users entering the funnel and those making it all the way to the bottom of the funnel. Depending upon the decrease noticed, you can make improvements at every step to decrease dropout rates.
For example, we know that 20% of users abandon the checkout funnel on the sign in / register page. As a result, many companies have completely decommissioned the registration flow. Instead, right before or right after an order is placed, the app will ask you if the user wants to enter a password (and nothing else) for the account to be created.
By looking at how people react within a funnel and their exit rates, you can find ways to improve the funnel performance (and hopefully decrease those rates).
Your app is now one step closer to becoming a success story!
If information is power, then data is power.
As an institutional discipline, analytics is one of the most important functions a company can possibly establish. I look at the analytics team in my group as being there to keep me honest. Their role is not to worry about my feelings or my opinions, but to report objectively on what users do, how they do it, and what they don’t do. It is to highlight redundancies, find areas of opportunity for improvement, and to keep me informed on whether I’m on target to meet my KPIs or not.
In the field of software development, everyone goes 100 miles per hour. I strongly suggest implementing the 17 in-app analytics key performance indicators listed above. By using them, you can make sure that you’re not racing 100 miles per hour on the bridge to nowhere.
Did you learn something new from this article about the best mobile app analytics fundamentals and strategies?
If so, we invite you to share it on Facebook / Twitter / Linkedin. Help your friends get the same knowledge you now possess.